
How to Integrate Power BI with Microsoft Dynamics 365 F&O for Better Decision-Making
Introduction to Dynamics 365 F&O Power BI Integration
The Dynamics 365 F&O Power BI integration is one of the most powerful combinations in modern enterprise technology. This integration enables organizations to visualize, analyze, and act upon their ERP data in real time. In today’s fast-paced business environment, the ability to make quick and data-driven decisions determines success.
Microsoft Dynamics 365 Finance and Operations (F&O) is a comprehensive ERP platform that handles everything from finance to supply chain management. When combined with Power BI, Microsoft’s leading data visualization and analytics tool, businesses can transform raw data into actionable insights.
Power BI brings data storytelling to life with interactive dashboards and intuitive reporting capabilities. It allows business leaders to explore data across every department—from accounting to manufacturing—and make informed choices based on visual evidence. The integration streamlines ERP data analytics, offering a unified system where decision-makers don’t need to juggle between platforms.
Moreover, organizations in India and globally are realizing the need for financial reporting tools that not only provide accuracy but also transparency. Microsoft data visualization through Power BI ensures clarity, enabling teams to track KPIs, revenue, and performance metrics in a visually rich format.

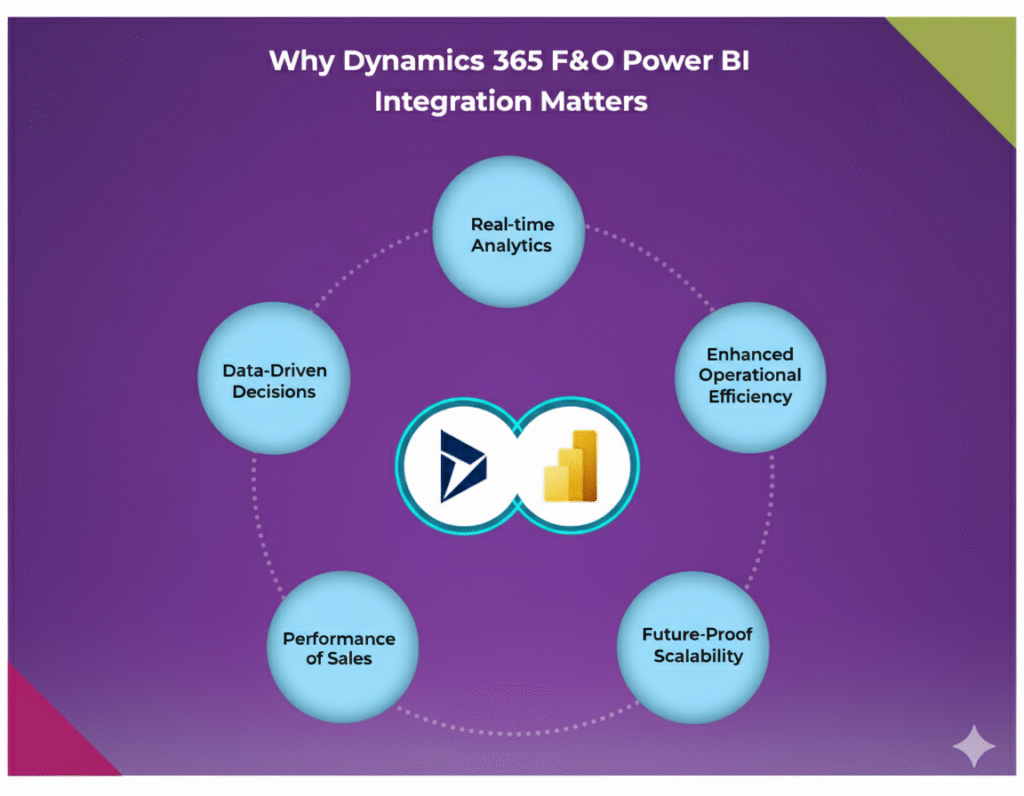
Why Dynamics 365 F&O Power BI Integration Matters
In the digital age, data is the new oil, and Dynamics 365 F&O Power BI integration is the refinery that turns it into value. Businesses using Dynamics 365 F&O already possess a massive amount of operational and financial data. However, raw data by itself holds little meaning until it’s analyzed effectively.
By connecting Power BI, companies gain access to real-time ERP data analytics, transforming numbers into stories and dashboards into decision enablers. This integration bridges the gap between business operations and data-driven strategies. It ensures that leaders no longer depend on manual reports or outdated spreadsheets.
With Power BI dashboards embedded directly within Dynamics 365 F&O, users can monitor key metrics—like sales performance, production rates, or financial KPIs—instantly. This not only enhances transparency but also speeds up decision-making. When every department, from procurement to HR, can visualize their performance metrics, collaboration naturally improves.
In addition, Power BI brings self-service analytics to employees at all levels. Even non-technical users can generate interactive reports without needing IT assistance. This democratization of data leads to a more empowered workforce and better alignment across business goals.
Ultimately, the integration creates a single source of truth, where every business function works with accurate, updated, and visualized data.
Understanding Microsoft Dynamics 365 F&O and Power BI Capabilities
Before diving deeper into Dynamics 365 F&O Power BI integration, it’s crucial to understand what each platform brings to the table. Microsoft Dynamics 365 Finance and Operations (F&O) is a robust enterprise resource planning (ERP) system designed to streamline business processes—covering finance, supply chain, manufacturing, and operations. Its primary purpose is to help organizations maintain control over their financial and operational data, ensuring precision and compliance.
Power BI, on the other hand, is Microsoft’s flagship data visualization and business analytics tool. It enables users to transform complex datasets into interactive dashboards and insightful reports. From CEOs to accountants, Power BI empowers everyone to interpret business data visually and make informed decisions faster.
When integrated, these two systems create a seamless analytical environment. Dynamics 365 F&O collects, stores, and manages business data, while Power BI analyzes and visualizes it. This combination offers clarity across every business process—whether tracking supply chain bottlenecks, forecasting revenue, or analyzing employee performance.
Moreover, Power BI’s ability to connect with multiple data sources—both within and outside the ERP—makes it even more powerful. Businesses can combine ERP data with CRM, HR, or even third-party applications to get a complete 360-degree view. This unified approach ensures that leaders never rely on assumptions but make decisions backed by solid analytics.
The true strength of this integration lies in real-time synchronization. Decision-makers don’t have to wait for end-of-month reports to understand performance. They can instantly view financial reporting tools and metrics updated directly from Dynamics 365 F&O, leading to faster and more strategic actions.
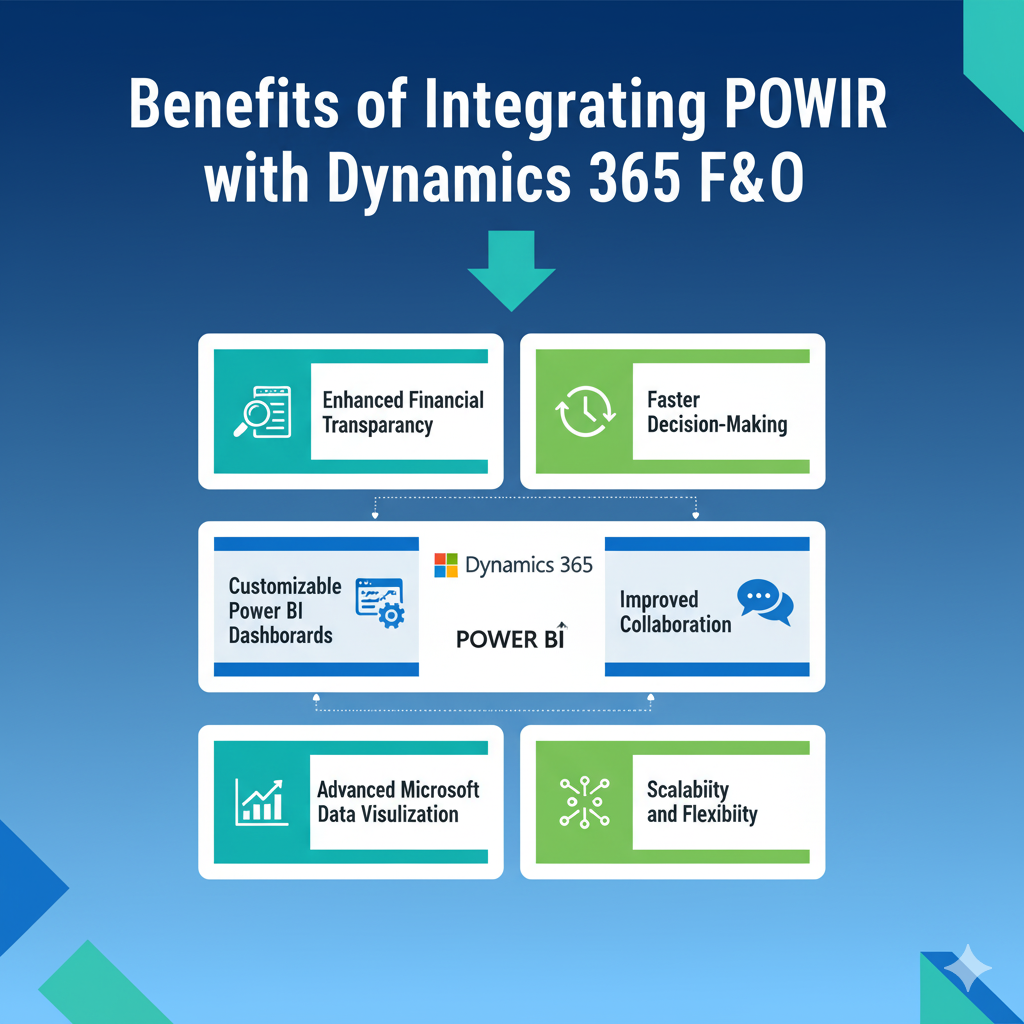
Benefits of Integrating Power BI with Dynamics 365 F&O
The benefits of Dynamics 365 F&O Power BI integration are extensive, touching nearly every aspect of business management. For starters, it enhances ERP data analytics by offering clear visual representations of data that are easy to interpret and share.
- Enhanced Financial Transparency – Power BI enables detailed financial dashboards that reflect real-time insights. From cash flow projections to profit margins, decision-makers can track financial performance on the go.
- Faster Decision-Making – Instead of relying on manual data exports, teams can view updated insights directly within Dynamics 365 F&O. This reduces reporting delays and empowers quick business actions.
- Customizable Power BI Dashboards – Every department can design dashboards tailored to their KPIs. For example, finance teams can focus on budgeting and variance analysis, while operations teams can monitor production efficiency.
- Improved Collaboration – When everyone works with the same visualized data, discussions become more productive. Shared dashboards promote data-driven conversations across departments.
- Advanced Microsoft Data Visualization – Power BI provides advanced tools like drill-downs, slicers, and trend lines. These interactive elements allow users to explore data deeper, uncovering patterns that static reports might miss.
- Scalability and Flexibility – As businesses grow, Power BI scales with them. It integrates seamlessly with other Microsoft services like Azure and Excel, making it ideal for long-term adoption.
Essentially, integrating Power BI with Dynamics 365 F&O turns your ERP into an intelligent decision-making engine. The days of waiting for static, month-end reports are gone; businesses can now adapt in real time to market changes and internal performance metrics.
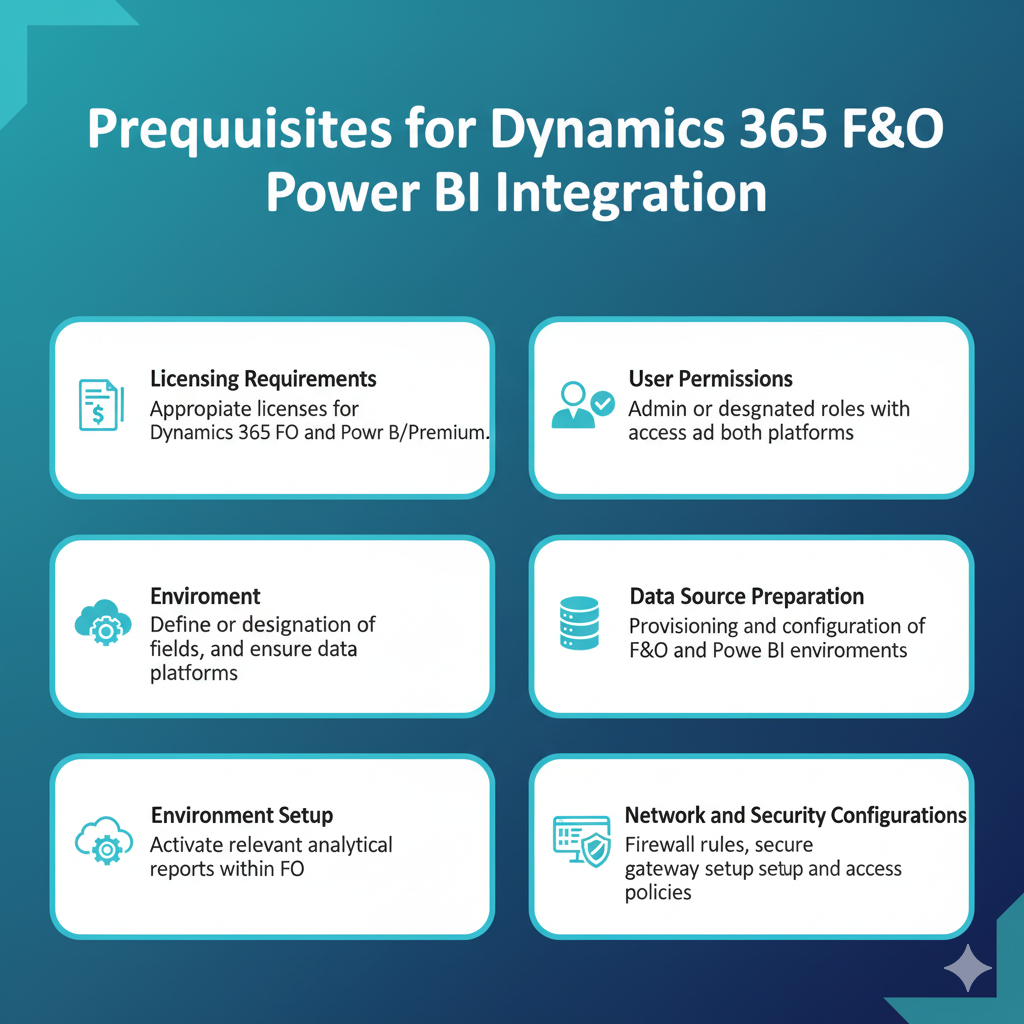
Prerequisites for Dynamics 365 F&O Power BI Integration
Before you begin, several technical prerequisites ensure a smooth Dynamics 365 F&O Power BI integration. Ignoring these can cause errors during setup or limit functionality later.
- Licensing Requirements – You’ll need active subscriptions for both Dynamics 365 F&O and Power BI. Additionally, Power BI Pro or Premium licenses are necessary for sharing and collaboration.
- User Permissions – Ensure users have appropriate security roles in both platforms. Power BI needs data access permissions, while Dynamics 365 F&O requires administrative privileges for integration setup.
- Data Source Preparation – Clean, structured data is crucial. Identify which entities in Dynamics 365 F&O you’ll connect—such as General Ledger, Accounts Receivable, or Inventory.
- Environment Setup – Confirm that your Power BI workspace and Dynamics 365 environment are configured properly. If your organization uses Azure Active Directory, ensure user authentication is streamlined.
- Enable Analytical Workspaces – Dynamics 365 F&O includes built-in analytical workspaces that support embedded Power BI content. Make sure they’re activated before connecting external reports.
- Network and Security Configurations – Check firewall settings and ensure communication between Power BI and Dynamics 365 F&O endpoints is open. Data encryption and secure gateways must be configured to maintain compliance.
Meeting these prerequisites is like laying a strong foundation before building a house. Once these steps are completed, the actual integration becomes far smoother and more efficient.
Step-by-Step Guide to Integrate Power BI with Dynamics 365 F&O
Let’s walk through the exact process for connecting Power BI with Dynamics 365 Finance and Operations. The following steps will help ensure your setup is optimized for performance and scalability:
Step 1: Enable Analytical Workspaces
In Dynamics 365 F&O, navigate to System Administration → Setup → Power BI. Here, enable the analytical workspaces option. This allows Power BI content to embed directly within the ERP.
Step 2: Configure Power BI Service
Sign in to Power BI with the same organizational credentials used for Dynamics 365 F&O. Create a workspace, define access controls, and ensure the Power BI service is linked to your company’s Azure Active Directory.
Step 3: Connect Dynamics 365 F&O Data Entities
From the Power BI desktop, connect to Dynamics 365 F&O data entities using the OData feed URL. This link serves as the bridge for real-time data transfer. Select entities relevant to your analysis—financials, sales, or production.
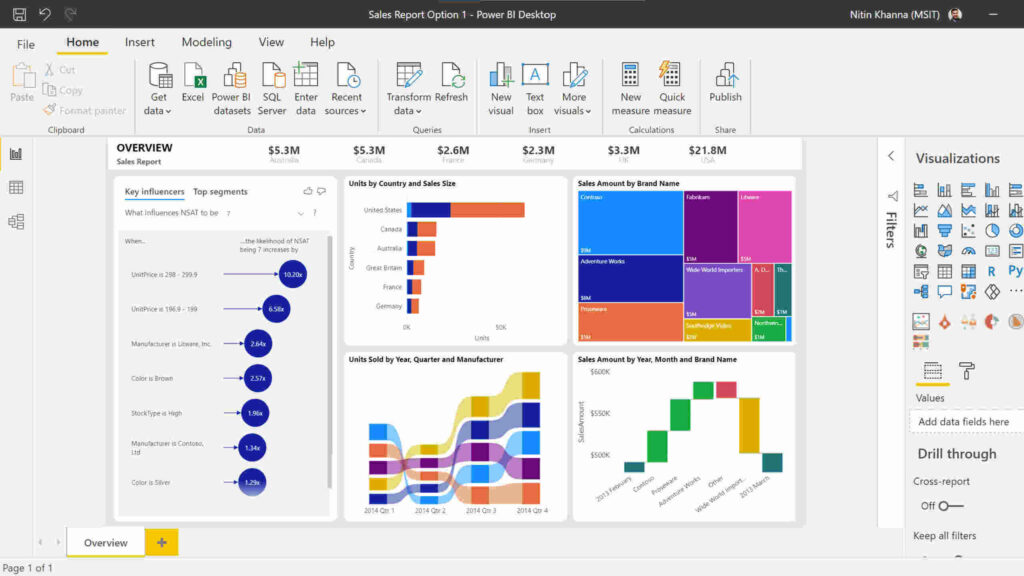
Step 4: Build Reports and Dashboards
Once the connection is established, use Power BI’s drag-and-drop interface to design dashboards. Utilize filters, visuals, and KPIs that align with your business goals.
Step 5: Publish to Power BI Service
After designing your dashboards, publish them to the Power BI Service. This step enables sharing and embedding within Dynamics 365 F&O.
Step 6: Embed Dashboards into Dynamics 365 F&O
In Dynamics 365, navigate to the desired workspace and insert the published dashboard. This provides users with visual insights directly in their daily workflow.
Following this process ensures a seamless, efficient integration that transforms Dynamics 365 F&O from a transactional system into a strategic analytics powerhouse.
Configuring Embedded Power BI Dashboards in Dynamics 365 F&O
Embedding Power BI dashboards directly into Microsoft Dynamics 365 Finance and Operations is one of the most powerful ways to create a unified analytics experience. Instead of toggling between applications, users can view their key metrics and performance visuals inside their ERP workspace. This integration reduces the time spent searching for data and ensures decisions are made faster, right where the data originates.
To embed dashboards, start by confirming that Power BI integration is enabled within your Dynamics 365 environment. Then, navigate to the desired workspace—such as “Financial performance” or “Operations overview.” From there, select the Customize Workspace option, and choose “Add Power BI tile.”
You can either embed pre-published Power BI reports from your organization’s workspace or link a specific dataset relevant to that department. For example, finance users might embed dashboards that show cash flow trends, expense ratios, or revenue growth by region. Operations teams can embed visuals tracking inventory turnover, production downtime, and shipment accuracy.
Customization Tips:
- Use role-based views so that employees see dashboards relevant to their responsibilities.
- Keep visuals minimal and meaningful—avoid cluttering workspaces with too many charts.
- Optimize Power BI reports for speed and performance by reducing unnecessary visuals or filters.
One of the biggest advantages of this embedded setup is real-time ERP data analytics. As soon as transactions are updated in Dynamics 365 F&O, they reflect automatically in Power BI dashboards. This creates a live, dynamic environment where decisions are based on the latest data, not on outdated spreadsheets.
Moreover, embedding Power BI dashboards improves collaboration. Team members working on the same workspace can discuss metrics, highlight anomalies, and align their actions based on consistent data insights. This capability turns Dynamics 365 F&O into more than just an ERP—it becomes a true data-driven decision-making hub.

Using Power BI for ERP Data Analytics
When it comes to ERP data analytics, Power BI stands as a game changer. Integrating it with Dynamics 365 F&O allows organizations to unlock valuable insights from structured ERP datasets. Instead of just storing transactional data, companies can now analyze trends, forecast performance, and predict future outcomes.
Power BI’s biggest advantage lies in its data modeling capabilities. It lets users connect various entities like General Ledger, Accounts Payable, Procurement, and Inventory. You can then establish relationships between these entities to visualize how changes in one area affect others. For instance, fluctuations in procurement costs can be directly linked to profit margins or customer pricing.
Here’s how companies use Power BI for ERP analytics:
- Financial Analysis: Evaluate profitability, cash flow, and expense patterns.
- Operational Efficiency: Monitor production cycles, supply chain lead times, and order fulfillment rates.
- HR and Workforce Data: Assess employee performance, payroll trends, and departmental productivity.
What makes Power BI unique is its ability to transform dry tables into stunning Microsoft data visualizations—using charts, graphs, and KPIs that instantly make sense to anyone. These visuals go beyond numbers; they tell stories about what’s really happening inside your business.
Additionally, Power BI supports natural language queries. A manager can type a question like “Show revenue growth for Q3” and get an instant visualization. This AI-driven feature simplifies data access for non-technical users, ensuring that decision-making is democratized across all departments.
As businesses in India and globally strive for agility, ERP data analytics through Power BI offers the visibility needed to stay ahead of competition. It allows leaders to not just react to data—but to anticipate trends and plan strategically.
Building Financial Reporting Tools with Power BI
The backbone of every business decision is strong financial reporting. With Power BI integrated with Dynamics 365 F&O, companies gain access to robust financial reporting tools that go far beyond traditional Excel-based reporting.
Power BI enables users to create interactive income statements, balance sheets, and cash flow dashboards. Unlike static reports, these visuals update automatically as new transactions are recorded in Dynamics 365 F&O. This automation eliminates manual consolidation errors and ensures decision-makers always view accurate, real-time financial health.
Some of the most impactful Power BI dashboards for finance include:
- Profit and Loss Analysis: Real-time visualization of revenue, cost of goods sold, and net profit margins.
- Expense Monitoring: Detailed tracking of operational expenses across cost centers.
- Budget vs Actuals Comparison: Automated variance reporting with drill-down capabilities.
One standout advantage of Power BI in finance is its Microsoft data visualization strength. Complex financial ratios and KPIs can be represented visually through heat maps, gauges, and line charts. These intuitive visuals simplify data interpretation for both finance experts and non-financial executives.
Furthermore, Power BI can integrate with Azure Machine Learning to create predictive financial models. This means CFOs can forecast revenue trends, detect anomalies in expenses, and make proactive adjustments before problems escalate.
When coupled with Dynamics 365 F&O, Power BI turns financial management from a backward-looking reporting process into a forward-focused strategic function. Organizations can identify inefficiencies, forecast future outcomes, and align financial goals with operational realities—all from a single integrated platform.
Optimizing Power BI Dashboards for Business Operations
An effective dashboard does more than display data—it drives decisions. For companies using Dynamics 365 F&O Power BI integration, optimizing dashboards ensures that every stakeholder gets meaningful insights without confusion or clutter.
Here’s how to create high-performing Power BI dashboards tailored for operational excellence:
- Focus on Key Metrics: Identify the metrics that matter most—like sales order fulfillment rates, production efficiency, and supplier delivery times. Avoid overwhelming users with too much data.
- Design Role-Based Dashboards: Create different dashboards for finance, HR, production, and logistics. Each should highlight KPIs relevant to that department.
- Use Interactive Filters and Drill-Throughs: Allow users to explore data by region, product line, or time period. Interactivity encourages engagement and deeper insights.
- Ensure Real-Time Refresh Rates: With ERP data analytics, real-time data updates are crucial. Configure Power BI refresh settings for timely updates from Dynamics 365 F&O.
- Optimize for Mobile Devices: Power BI’s responsive design ensures dashboards are accessible on smartphones and tablets—perfect for executives on the move.
An optimized dashboard also means faster performance. Minimize the number of visuals on each page, use summarized datasets, and rely on Power BI’s aggregation capabilities.
When done right, these dashboards not only improve business visibility but also foster accountability. Each department can monitor its performance independently, identify trends early, and make proactive improvements.
Most importantly, optimized dashboards cultivate a data-driven culture—one where decisions are based on analytics, not intuition.
Common Challenges in Dynamics 365 F&O Power BI Integration
While Dynamics 365 F&O Power BI integration unlocks powerful analytical capabilities, the process is not without its challenges. Businesses often face several technical and operational obstacles during setup and ongoing usage. Understanding these hurdles early can help ensure smoother integration and sustained performance.
- Data Latency and Synchronization Issues:
One of the most common problems is data refresh delays between Dynamics 365 F&O and Power BI. Since Power BI often pulls data through OData feeds or the Data Lake, real-time synchronization can be affected by bandwidth, server load, or network latency. When reports lag, decision-making becomes reactive instead of proactive. The key to overcoming this challenge lies in scheduling frequent data refreshes, optimizing OData queries, and using Azure Data Lake Storage for near-real-time updates. - Security and Governance Concerns:
With sensitive financial and operational data flowing between systems, security must be a top priority. Companies need to ensure role-based access controls are correctly configured in both Dynamics 365 F&O and Power BI. Misconfigured permissions can lead to unauthorized access or data leakage. It’s also essential to align Power BI access with the organization’s Azure Active Directory (AAD) roles to ensure consistent governance. - Performance Bottlenecks:
Large data models can slow down Power BI dashboards, especially when dealing with complex ERP datasets. Businesses should avoid loading unnecessary columns or tables into Power BI. Instead, use aggregated datasets and leverage Power BI’s Dataflow feature to pre-process data. - Troubleshooting Errors:
Integration issues can arise due to API connection failures, outdated drivers, or misaligned environment configurations. Regular monitoring through Power BI Gateway Logs and Lifecycle Services (LCS) in Dynamics 365 can help identify and resolve these issues quickly. - Change Management:
The introduction of new analytics tools can face resistance from employees accustomed to legacy reporting methods. Conducting training sessions and demonstrating the value of Power BI dashboards can help teams transition smoothly.
Overcoming these challenges requires a combination of technical planning, governance discipline, and user education. Once resolved, organizations can fully leverage ERP data analytics to enhance efficiency and business agility.
Power BI and AI: The Future of ERP Data Analytics
The future of Dynamics 365 F&O Power BI integration lies in the power of artificial intelligence (AI) and machine learning. Microsoft is continuously embedding AI features into Power BI, enabling organizations to move from descriptive analytics to predictive and prescriptive insights.
AI in Power BI allows businesses to identify patterns that human analysts might miss. For example, the tool can automatically detect anomalies in financial transactions or forecast future cash flows using historical data. With AI visuals like Key Influencers, Decomposition Trees, and Smart Narratives, Power BI provides deeper contextual understanding of what drives business outcomes.
When integrated with Dynamics 365 F&O, these AI capabilities amplify ERP data’s value. For instance, supply chain managers can predict inventory shortages before they happen. Financial controllers can forecast upcoming expenses or revenue fluctuations based on current trends.
Moreover, Power BI’s integration with Azure Cognitive Services enables sentiment analysis, image recognition, and predictive modeling—all accessible directly through Power BI’s interface. This means businesses don’t need separate AI tools; everything is embedded within the analytics environment.
As businesses in India and globally adopt digital transformation, AI-driven ERP data analytics will become a competitive necessity. Decision-makers won’t just react to reports—they’ll anticipate opportunities and mitigate risks proactively.
This blend of Microsoft data visualization and AI ensures that organizations stay one step ahead in their financial and operational strategy. The line between data and decision-making continues to blur, creating intelligent enterprises driven entirely by insights.

