Dynamics 365 F&O Reporting Tools: How to Get the Most Out of Your Data
Introduction to Dynamics 365 Reporting Tools
The Dynamics 365 reporting tools are powerful instruments that help businesses transform raw data into actionable insights. In today’s fast-moving world, data-driven decision-making is not optional—it’s essential. Microsoft Dynamics 365 Finance and Operations (F&O) provides an integrated suite of reporting and analytics tools that help companies stay ahead by visualizing their financial and operational performance in real time.
Every business today collects massive amounts of data from sales, operations, HR, and finance. Without the right reporting tools, this data remains just numbers. Dynamics 365 bridges this gap by offering customizable reports, real-time dashboards, and Power BI integration for deeper analysis. The goal is to turn information into intelligence—helping organizations make smarter, faster, and more confident decisions.

Understanding Dynamics 365 Reporting Tools
Dynamics 365 reporting tools combine flexibility, scalability, and intelligence. They allow users to build reports that reflect both operational and financial performance across departments. These tools help analyze patterns, identify bottlenecks, and monitor KPIs effectively.
Unlike traditional static reports, the modern reporting system in Dynamics 365 F&O offers interactive visualization. Decision-makers can drill down into details with just a few clicks. The interface is intuitive, allowing both technical and non-technical users to navigate with ease.
Dynamics 365 reports are powered by an integrated data model. This ensures consistency across modules like finance, supply chain, and HR. Whether you’re tracking revenue, expenses, or project timelines, Dynamics 365 reporting maintains accuracy while saving time.
In essence, these tools help businesses align data with strategy, ensuring that every decision supports overall growth.

Financial Reporting in Dynamics 365: A Comprehensive Overview
Financial reporting in Dynamics 365 empowers finance teams to prepare accurate, compliant, and insightful statements. It’s not just about creating reports—it’s about driving performance through real-time data visibility.
The financial reporting module includes templates for balance sheets, profit and loss statements, cash flow reports, and more. These can be customized to match your organization’s structure and reporting standards. Built-in features like account hierarchies, filters, and consolidation options make multi-entity reporting easier than ever.
Automation plays a big role here. Instead of spending hours compiling spreadsheets, finance teams can generate live reports with a single click. This improves efficiency and minimizes the risk of human error.
Most importantly, the system enables role-based access. CFOs can view consolidated data, while accountants focus on specific segments. With integrated performance analytics, businesses can analyze spending patterns and revenue growth in real time.
Overall, financial reporting in Dynamics 365 helps organizations manage budgets efficiently, predict cash flows, and ensure regulatory compliance—all through an intuitive reporting interface.
Power BI Integration with Dynamics 365 F&O
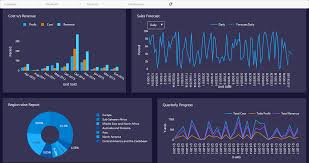
Power BI integration takes the capabilities of Dynamics 365 reporting tools to the next level. Power BI is Microsoft’s flagship business intelligence platform, and when integrated with Dynamics 365, it provides a visual, interactive, and analytical reporting experience.
Through this integration, businesses can:
- Visualize data in real-time dashboards and charts.
- Connect data across multiple systems for unified analytics.
- Share insights securely across teams or departments.
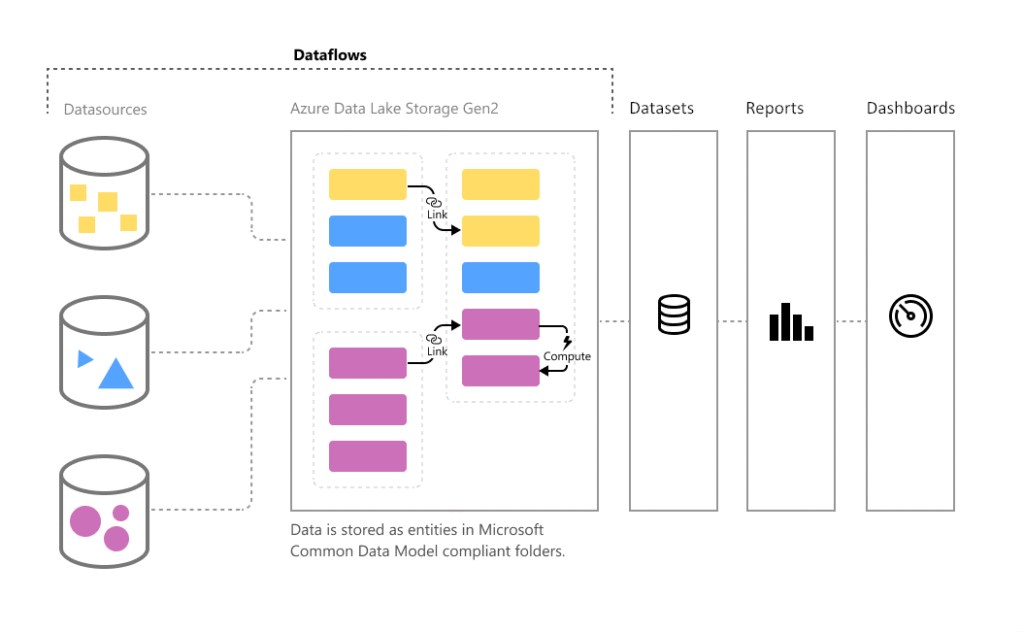
Step-by-Step Power BI Integration Process:
- Connect Dynamics 365 F&O to Power BI using embedded content packs.
- Configure the Power BI workspace for your organization.
- Map datasets to ensure data consistency.
- Design and publish customized dashboards.
Common Power BI Use Cases:
- Monitoring sales trends and forecasting demand.
- Tracking project profitability and cost performance.
- Evaluating employee productivity and resource utilization.
By combining Power BI integration and Dynamics 365 reporting tools, organizations gain a single source of truth for all their business metrics. The visual appeal of Power BI reports encourages collaboration and supports informed decision-making at every level.
Real-Time Dashboards for Smarter Business Decisions
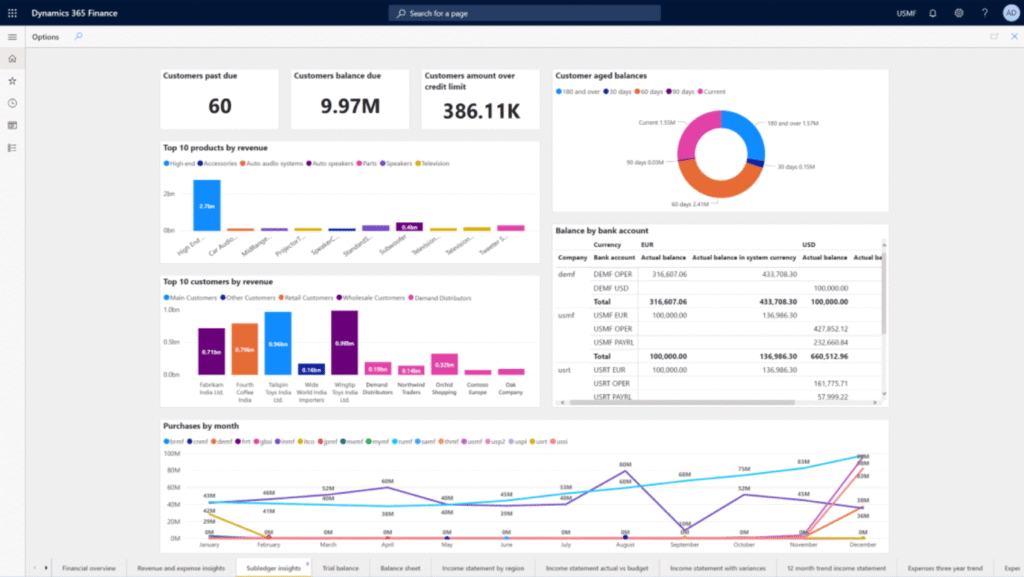
Real-time data drives better decisions. Real-time dashboards in Dynamics 365 F&O allow managers to monitor critical KPIs without delays. These dashboards display up-to-date information pulled directly from operational systems, ensuring accuracy and timeliness.
Dashboards can be customized to show sales targets, revenue progress, cash flow status, or operational metrics. The visuals—charts, graphs, and tables—provide an instant snapshot of performance. Managers can instantly identify deviations and take corrective action.
For instance, a sales dashboard may display daily sales compared to targets. If numbers dip, alerts can be configured to notify stakeholders immediately. This proactive approach reduces risks and enhances responsiveness.
Moreover, integrating dashboards with Power BI enhances interactivity. Users can drill down into regional data, departmental reports, or time-based comparisons. This deep visibility makes real-time dashboards one of the most valuable assets of Dynamics 365 reporting tools.
Performance Analytics and Advanced Insights
Performance analytics go beyond numbers—they tell a story. The performance analytics feature in Dynamics 365 enables users to analyze historical data, compare trends, and identify performance drivers.
Businesses can track metrics like operational efficiency, sales growth, and financial ratios. The system automatically gathers data from multiple sources and converts it into meaningful visualizations.
Predictive analytics add another layer of intelligence. With AI-driven models, organizations can forecast outcomes such as sales trends, customer churn, or cost overruns.
Here’s how performance analytics benefit organizations:
- Identify underperforming areas.
- Predict future opportunities and risks.
- Benchmark performance against industry standards.
By using performance analytics, businesses can turn past performance into future strategy. This capability strengthens competitiveness and ensures sustainable growth.

Enhancing Operational Efficiency through Reporting Tools
Operational efficiency is the heartbeat of any organization. The Dynamics 365 reporting tools enable companies to streamline workflows and eliminate redundant processes through automation.
Automated Reporting: Reports that once took hours to compile can now be generated instantly. This saves time for employees and increases data accuracy.
Cross-Departmental Collaboration: When every team—from finance to operations—has access to real-time reports, coordination becomes seamless. Shared insights help teams align their efforts toward common goals.
AI and Smart Analytics: Dynamics 365 leverages AI to identify performance gaps and recommend improvements. For example, if a process consistently exceeds budget, the system alerts managers with actionable insights.
With the right reporting setup, companies can enhance both efficiency and transparency across their operations.
Customizing Reports in Dynamics 365
Every business is unique, and that’s why customization is one of the most powerful features of Dynamics 365 reporting tools. With Dynamics 365 Finance and Operations (F&O), you can tailor every report to suit your organizational goals and data needs.
- Building Personalized Financial and Operational Reports
Users can build financial reports that reflect key business metrics such as revenue, expenses, or profitability. These reports can be designed using predefined templates or created from scratch. The drag-and-drop designer in Dynamics 365 makes it simple to add data elements, visuals, and filters.
Custom financial statements can highlight departmental performance, cost breakdowns, or budget comparisons. Similarly, operational teams can create project reports to track milestones and delivery efficiency.
- Adding Filters, Visuals, and KPIs
Dynamic filters help users drill down into specific data points. For example, a finance manager can filter reports by region, time period, or cost center. Visual aids like graphs, pie charts, and trend lines make data more engaging and easier to interpret.
Additionally, incorporating performance analytics and KPIs (Key Performance Indicators) provides measurable insights. For instance, tracking KPIs such as gross margin, return on investment (ROI), or cash flow ratio helps leaders assess organizational health at a glance.
- Sharing and Scheduling Reports Automatically
Dynamics 365 makes report sharing effortless. Reports can be exported to Excel, PDF, or shared directly via Microsoft Teams or email. Automated scheduling ensures stakeholders receive updated reports at regular intervals, such as weekly sales summaries or monthly financial reviews.
Customizing reports not only improves visibility but also ensures everyone in the organization works with the most relevant and timely data.

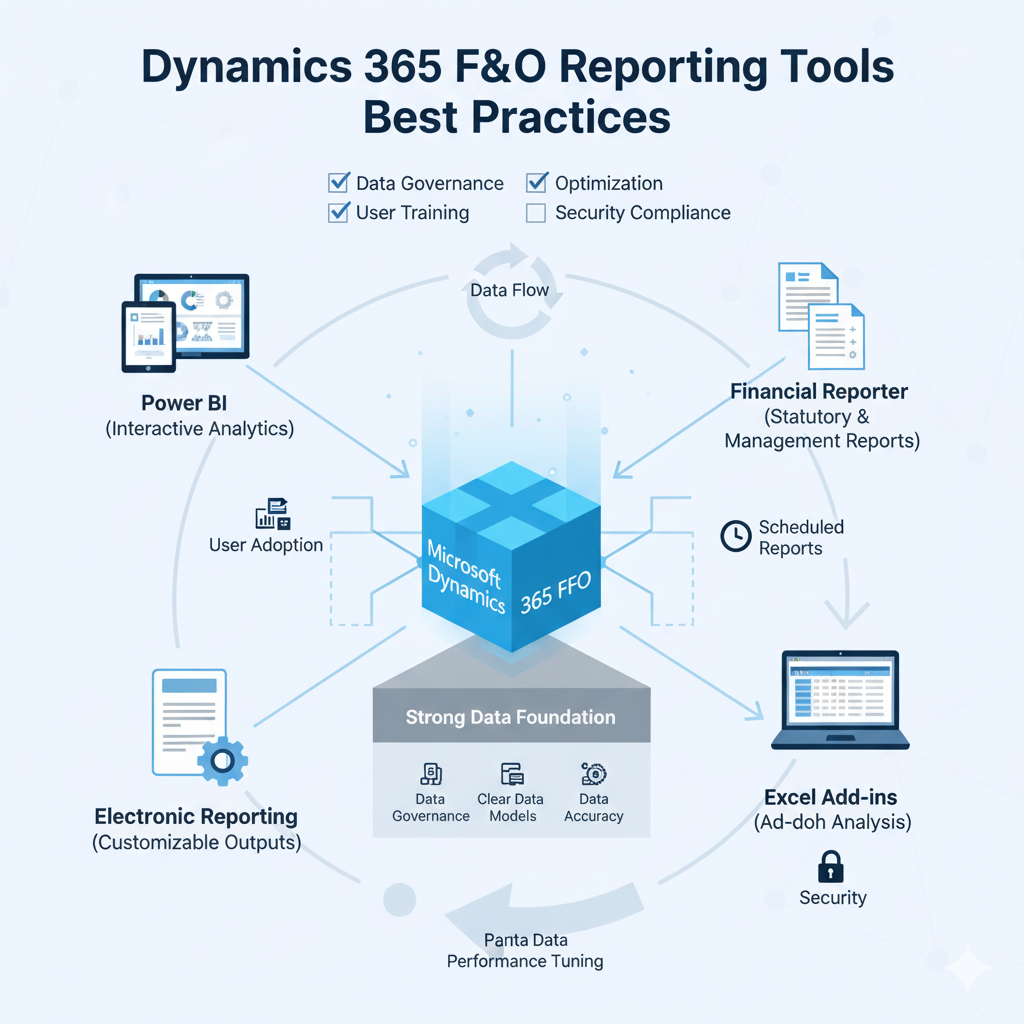
Dynamics 365 F&O Reporting Tools Best Practices
To fully leverage Dynamics 365 reporting tools, businesses must follow best practices that ensure accuracy, security, and usability.
- Data Governance and Security
Data integrity is vital for effective reporting. Establish clear governance policies to ensure only authorized users can access or modify data. Role-based access controls in Dynamics 365 allow businesses to assign permissions based on roles, reducing the risk of errors or breaches. - Improve Data Accuracy with Standard Templates
Standard templates reduce the risk of inconsistent reporting. By using Microsoft’s built-in templates or creating standardized versions for your organization, you maintain accuracy and uniformity. Consistent report layouts also help stakeholders interpret information faster. - Training Teams for Effective Report Utilization
Many organizations underutilize reporting tools due to lack of user training. Invest in upskilling employees to create, analyze, and share reports efficiently. Encourage them to explore Power BI integration for visual storytelling and real-time insights. - Review and Update Data Regularly
Business dynamics evolve quickly. Review your reports frequently to ensure data sources, KPIs, and filters remain relevant. Keeping reports updated ensures decisions are always based on accurate and current information.
When businesses follow these best practices, the value of Dynamics 365 reporting tools multiplies—turning data into a strategic advantage.
Common Challenges in Dynamics 365 Reporting and Their Solutions
Even though Dynamics 365 reporting tools are powerful, businesses may encounter certain challenges during implementation and use. Understanding these issues and applying the right solutions ensures smooth operations.
- Data Duplication and Inconsistency
Duplicate or inconsistent data can distort reports and lead to faulty decisions. To fix this, organizations should integrate all data sources into a single unified system and schedule regular data audits. Using Power BI’s data cleansing features also ensures high-quality data. - Managing Complex Datasets Efficiently
As businesses grow, data complexity increases. Handling large datasets can slow down system performance. The solution lies in using Power BI integration with data compression techniques and incremental refresh options to handle massive records efficiently. - Optimizing System Performance for Faster Reporting
Large-scale reporting can impact Dynamics 365 F&O’s performance. To optimize, limit unnecessary data fields, use summarized data for reports, and schedule intensive reports during off-peak hours. - User Adoption Challenges
Users often find new systems intimidating. Overcome this by providing structured training sessions and simplified dashboards. Once users experience the convenience of real-time dashboards and financial reporting in Dynamics 365, adoption naturally increases.
By tackling these common issues proactively, organizations can make the most of their reporting infrastructure and avoid delays in data-driven decision-making.
Future of Reporting in Dynamics 365 F&O
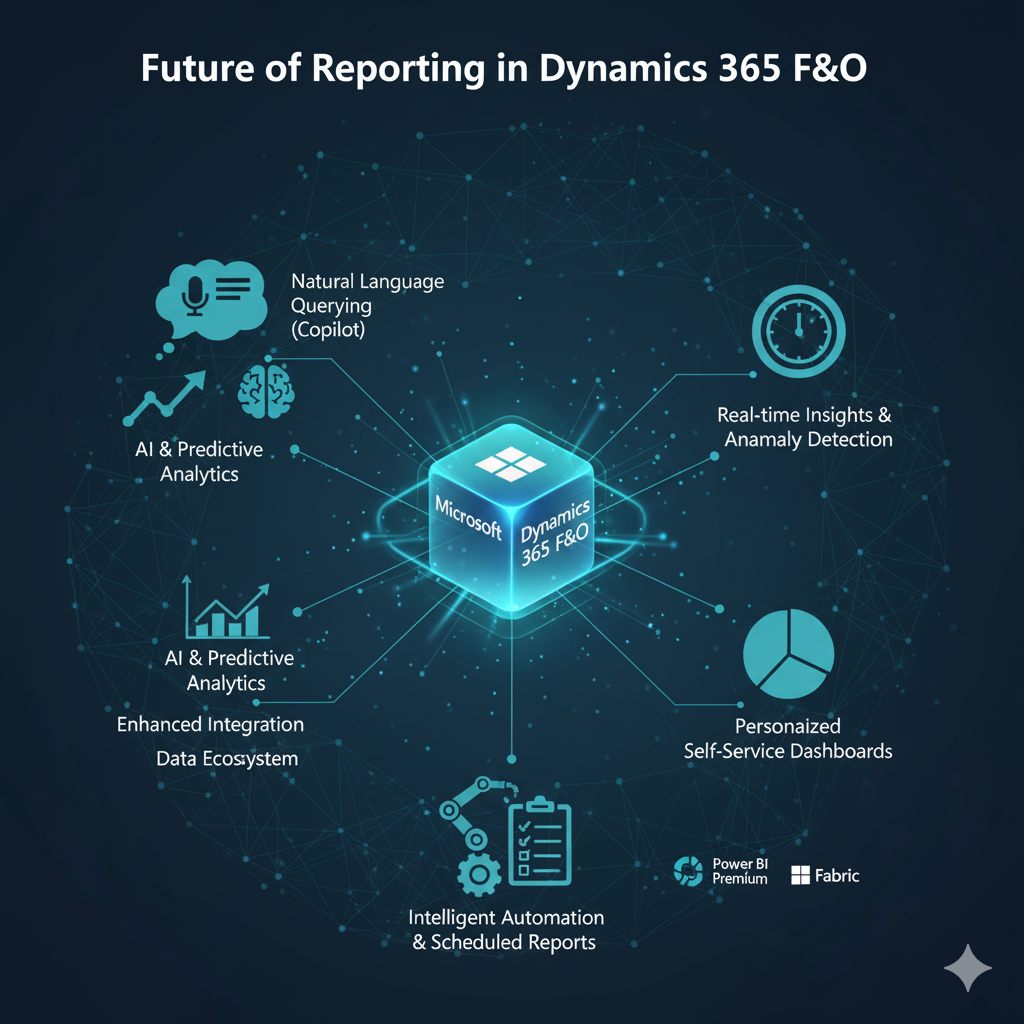
The future of Dynamics 365 reporting tools is set to redefine how organizations interact with their data. Microsoft continues to innovate, adding advanced AI and automation capabilities that enhance user experience and decision-making power.
- Emerging Trends in Business Analytics
As businesses transition to digital ecosystems, the demand for advanced analytics is growing. Future updates to Dynamics 365 will focus on embedded analytics, voice-enabled reports, and deeper Power BI integration for AI-driven insights. - Role of AI and Machine Learning
AI will soon become an integral part of financial and operational reporting. It will help identify trends, detect anomalies, and predict future outcomes. For example, machine learning models can analyze past transactions to forecast revenue or detect financial risks. - Cloud-Based Innovations in Dynamics 365 Reporting
With the expansion of Microsoft Azure, cloud-based reporting is becoming faster and more secure. Cloud storage enables businesses to access data anytime, anywhere, ensuring scalability and flexibility. Cloud computing also allows seamless synchronization across multiple global entities. - Interactive and Collaborative Reporting
Future versions of Dynamics 365 F&O will encourage collaboration through shared workspaces. Teams can co-edit reports, add comments, and make real-time adjustments—enhancing transparency and teamwork.
The future clearly belongs to intelligent, automated, and integrated analytics. Businesses that embrace these tools today will have a distinct competitive edge tomorrow.